
Demand forecasting: A comprehensive guide
Mastering demand forecasting could be your tipping point for efficient inventory management. It’s a simple yet powerful tool that helps you maintain just the right amount of stock, directly meeting customer demand.
This comprehensive guide will walk you through the nitty-gritty of demand forecasting work, highlighting the key techniques, and showing how inventory management software can make the task effortless.
Make stockouts and overstock a thing of the past with demand forecasting, the linchpin for enhancing your business operations.
What is demand forecasting?
Demand forecasting is an integral part of predictive analytics that helps anticipate customer demand. This forecasting allows ecommerce businesses to effectively manage their inventory, ensuring adequate stock levels while avoiding overstocking.
More than just managing inventory, accurate demand forecasting helps support crucial business decisions that can influence turnover and profit margins. Without demand planners doing accurate forecasting, businesses may risk inefficient product and market decisions. And in turn, that could increase inventory costs, hurt customer satisfaction, fail to meet customer demand and ultimately decrease profitability.
Demand forecasting can be done in numerous ways, including manual calculations or automated systems. Effective demand planning systems are timely, reliable, accurate, meaningful, and usable. While effective demand forecasting can support a wide range of activities, from production planning to market research, the focus here is on its role in improving inventory and stock control.
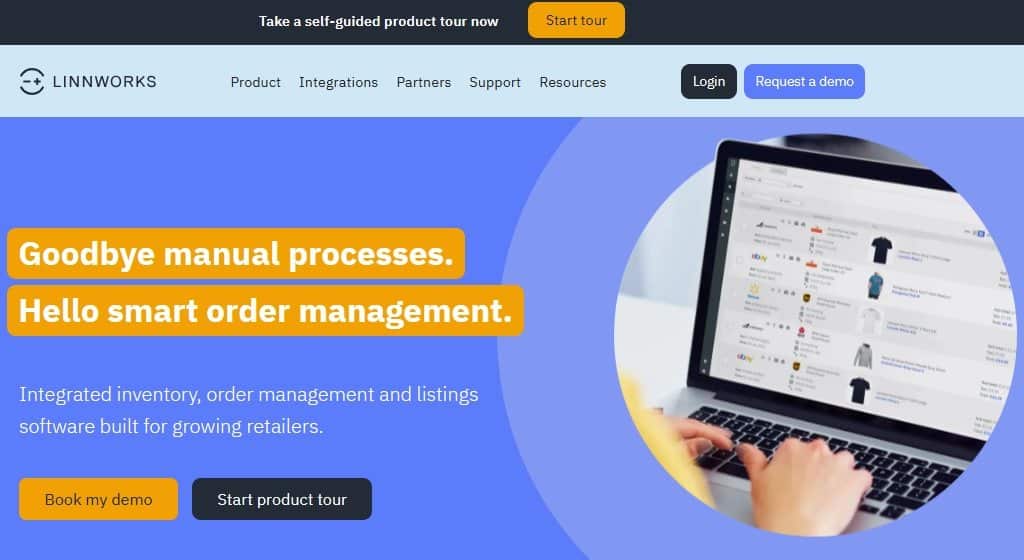
Discover how Linnworks leverages its stock forecasting functionality to predict your item’s demand forecast, here.
Why are demand forecasts more important than ever for ecommerce businesses?

The ecommerce landscape has transformed significantly in the wake of the global pandemic. The industry experienced unprecedented growth as consumers shifted to online shopping, leading to drastic changes in demand forecast patterns and supply chain dynamics. This period of rapid change highlighted the importance of having agile and responsive operations, underpinned by robust demand planning.
Alongside this, ongoing supply chain issues, including disruptions in production and transportation, have made demand forecasting even more crucial. It has become clear that businesses that can effectively forecast demand and adapt accordingly have a significant advantage in managing these challenges.
Demand forecasting is now more important than ever for ecommerce businesses, especially in today’s competitive and dynamic marketplace. Here’s why:
1. Gaining competitive advantage
By ensuring you’re never out of stock, demand forecasting software reduces the risk of customers turning to competitors. Plus, forecasting allows for the adjustment of marketing strategies to meet future customer demand, keeping you one step ahead.
2. Inventory optimization
More accurate demand forecasts enhances inventory management, effectively reducing overstocking and stockouts. This can lead to increased inventory turnover and decreased carrying costs, by keeping the right amount of stock at all times.
3. Improved budgeting and cash flow management
Accurate sales forecasts and demand forecasting provide valuable insights into forthcoming cash flow, improving budgeting for operational costs. This knowledge also facilitates smarter allocation of marketing spend to match business cycles, promoting steadier cash flow.
4. Informed decision-making
Demand planning systems provide crucial data insights, minimizing the risk of poor business decisions. It prevents potential drawbacks related to inventory costs, customer satisfaction, customer demand and overall profitability.
5. Boosted supply chain efficiency
Knowledge of product demand is critical to ensure a seamless connection between your manufacturers, suppliers, and your business. Accurate demand forecasting can help schedule production, warehousing, and shipping optimally, increasing supply chain efficiency.
How does demand forecasting work?

Demand forecasting techniques work by bringing together two types of information: qualitative and quantitative data.
- Qualitative data is gathered from external sources such as news reports, social media trends, and research on competitors and markets. Internal inputs like customer feedback and preferences are equally important here, too.
- Quantitative data is mostly internal information and relates to hard numbers like sales figures, busy shopping times, and insights from web and search data.
The role of technology
We live in a post-ChatGPT world. But tools like AI and machine learning can help us to make sense of complex data sets and improve the accuracy of our predictions. So when we apply these cutting-edge technologies to demand forecasting, it greatly improves the accuracy and resilience of supply chain management, while also helping us to keep pace with demand forecasts.
Simply put, demand forecasting software helps ecommerce businesses to anticipate what their customers will want and when they will want it, which in turn makes inventory planning a much smoother process.
Key factors that influence demand planning
Understanding the demand life cycle is crucial for ecommerce businesses, and a number of key factors can influence its shape and trajectory. Let’s take a dive into these factors and explore how they can impact demand planning.
1. Seasonality
Seasonality plays a significant role when it comes to demand forecast. For ecommerce businesses, seasonal variations can greatly influence sales. For example, holiday seasons such as Christmas or Thanksgiving typically see a surge in sales, while demand may dip during off-peak periods. During the 2022 Christmas shopping season, statistics from Adobe Analytis showed that consumers spent $72.2 billion online in October, 10.9% more than they did in September of the same year.
Understanding these seasonal trends can help businesses manage inventory more efficiently and maximize sales opportunities.
2. Economic conditions
The state of the economy can profoundly impact consumer buying behavior and therefore and item’s demand forecast. In times of economic prosperity, consumers may be more willing to spend, leading to increased demand. Conversely, during economic downturns, consumer spending may decrease as people prioritize essential purchases, causing a dip in demand for non-essential items.
Monitoring economic indicators can help businesses anticipate these shifts in demand.
3. Consumer preferences and trends
Consumer preferences and trends act as the pulse of the ecommerce industry. Trends are dynamic and often dictate what products consumers gravitate towards. For example, the ongoing trend towards remote work has triggered a surge in demand for home office equipment. The global home office furniture market size was valued at $3,032.6 million in 2020, and is estimated to register a CAGR of 8.8% from 2021 to 2030.
Businesses that can keep their finger on the pulse of these changing trends and rapidly adjust their offerings stand a better chance of meeting demand and staying competitive. In essence, staying on top of consumer trends can help predict demand forecast shifts and adapt accordingly.
4. Price
Price significantly sways customer demand and demand forecasting. Generally, if a product’s price is high, fewer customers may be willing to purchase it, leading to reduced demand. Conversely, lower prices can stimulate demand by making products more affordable to a wider audience.
However, it’s a delicate balance, as pricing products too low could impact profitability while pricing them too high could scare off potential customers. A well-planned pricing strategy can help businesses find the sweet spot where the product price matches its perceived value, effectively managing demand and ensuring profitability.
5. Marketing and advertising

The role of marketing and advertising in influencing demand forecasting can’t be overstated. Effective marketing campaigns and market research can heighten product awareness, generate consumer interest, and subsequently create demand for a product. Think of well-executed product launches that build anticipation and spike initial demand.
Influencer marketing and UGC (user-generated content) are ideal marketing strategies that can help ecommerce businesses achieve this, and with significant results. Hubspot surveyed over 1,000 global marketers in 2021, of which 61% said they planned to increase their investment in influencer marketing.
On the flip side, lackluster or misaligned marketing campaigns or market research can result in reduced demand or misinterpretation of the product value proposition. Therefore, a strategic and well-executed marketing plan can significantly boost demand and sustain it over time.
6. Product quality
Product quality is a powerful driver of demand. Products that consistently deliver high quality typically generate sustained demand, enjoy repeat purchases, and can command a loyal customer base.
Conversely, products perceived as low in quality often experience a decline in demand over time, as customers seek better alternatives. It’s essential to maintain consistent product quality to ensure ongoing demand. In addition, customer reviews and feedback can provide valuable insights into product quality perceptions, helping businesses address any issues and improve their offerings.
7. Social and political factors
Social and political factors can have far-reaching effects on demand forecasting. A growing trend is the increased demand for eco-products, driven by heightened awareness of environmental issues.
For instance, according to a 2020 report by the Capgemini Research Institute, nearly 79% of consumers are changing their purchase preferences based on environmental impact. This surge in demand for eco-friendly products underscores the importance of staying attuned to social and political trends when considering an item’s demand forecast.
6 types of demand forecasting methods
As outlined above, demand forecasting can be broken down into two core categories: qualitative, which deals with non-numerical data, and quantitative, which focuses on numerical or statistical data. These two approaches help navigate the complexities of supply chain dynamics.
If we dive deeper, we discover various demand forecasting methods, each serving a unique purpose.
Macro-level forecasting
Understanding the broader market dynamics is the realm of macro-level forecasting. By assessing general economic conditions and factoring in any external disruptions to ecommerce, businesses can gain valuable insights. These insights can highlight potential opportunities for market expansion or flag upcoming market shifts, enabling businesses to adjust their strategies accordingly.
Micro-level forecasting
In contrast to macro-level forecasting, micro-level forecasting focuses more on the details. This approach tends to be specific to a particular industry, business, or customer segment. The more targeted data analysis provides more granular insights and aids in making precise decisions for that specific area.
Short-term forecasting
With short term demand forecasting, we’re looking at the demand for a period of less than 12 months. This form of demand planning is crucial for managing day-to-day activities. For instance, it could guide the planning of a specific promotion, helping to maximize the impact of marketing efforts.
Long-term forecasting

Long-term forecasting, as the name suggests, explores demand over a period greater than 12 months. This form of demand forecasting is instrumental in identifying seasonal patterns, planning production capacity, and strategizing for expansion opportunities. It’s a crucial tool in shaping long-term business strategies.
Active demand forecasting
Turning our attention to demand types, Active Demand Forecasting focuses on goods or services that customers are actively seeking. It’s essential for ensuring high-demand items are kept in stock and guiding marketing strategies around these popular products.
Passive demand forecasting
On the opposite end, Passive Demand Forecasting zeroes in on products or services that aren’t actively sought out by customers. This approach helps businesses in planning strategies to stimulate demand for these items, or alternatively, in managing inventory for these less sought-after items.
Of course, there are more types of demand forecasting techniques too. However, each type of demand forecasting has its own unique role and value, and in practice, they often work in unison to create a comprehensive view of your demand landscape.
How to forecast demand: a 6-step framework
Navigating the path to successful demand forecasting might seem daunting. However, with a systematic approach, it becomes a lot more manageable. We’ve laid out a straightforward six-step framework that guides you through the demand forecast process.
From defining your initial objectives to making informed business decisions, each step aids in mastering the art of forecasting demand, leading to optimal decision-making for your ecommerce business.
1. Define the objective
Forecasting demand isn’t just about how to predict future sales and determine future demand. It’s about understanding what you want to achieve through this process. Whether you want to optimize your inventory levels, plan for future capacity requirements, or identify new market potential, defining your objective is the first crucial step.
To define your objective(s), consider your overall business goals. For instance, if your goal is to expand into new markets, your demand forecasting objective might be to understand the potential demand for your products in these new areas. Conversely, if you’re aiming to optimize your supply chain, your objective might be to predict demand more accurately to avoid overstocking or understocking issues.
Having a clear objective not only guides your demand forecasting process but also helps to align it with your business goals. It ensures that you’re forecasting the right things and using your resources effectively.
2. Choose a forecasting method
The next step is to choose a demand forecasting method. This choice will depend largely on the objective you’ve defined as step 1, as well as on the data you have available and your business context.
The forecasting method could range from simple trend projection, where you determine future demand based on past data, to more complex methods like econometric demand forecasting models, which use statistical analysis to predict demand.
There are also modern forecasting techniques, such as artificial intelligence and machine learning demand forecasting models, which can learn from your data and improve their forecasts over time. Remember, the method you choose should align with your objective and be feasible given your resources and data availability.
3. Collect and analyze data

Once you’ve chosen your forecasting method, the next step is to collect and analyze the relevant data. The data you collect could include historical sales data, market research data, and data on external factors that could influence demand, like economic conditions or consumer trends.
When collecting data, it’s important to consider both the quality and the quantity of the data. High-quality data will lead to a more accurate demand forecast, while having a sufficient amount of data will ensure that the demand forecast is reliable.
In the analysis phase, you’ll want to look for patterns and trends in your data that could help you predict future demand. This could involve statistical analysis or data visualization, depending on the complexity of your data and your chosen forecasting method.
4. Apply a demand forecast method
Having collected and analyzed your data, you can now apply your chosen forecasting method. This involves using your data to make a prediction about future demand.
If you’re using a simple forecasting method, like trend projection, this might involve extrapolating your past sales data into the future. If you’re using a more complex method, like a machine learning model, this might involve training your model on your data and then using it to make predictions.
Regardless of the method you choose, it’s important to apply it correctly and consistently. Misapplication of a forecasting method can lead to inaccurate forecasts, which could harm your business.
5. Interpret the results
After applying your forecasting method, you’ll be left with a set of results – your demand forecasts. The next step is to interpret these results.
Interpreting your forecasts involves understanding what they mean for your business. For instance, if your forecasts show a spike in demand for a certain product, this could mean you need to increase your production of that product. If your forecasts show a decline in overall demand, this could signal that you need to reassess your business strategy.
When interpreting your results, it’s also important to consider their limitations. All forecasts have a degree of uncertainty, and it’s important to understand this uncertainty when making decisions based on your forecasts.
6. Make business decisions
The final step in the demand forecasting process is to use your forecasts to make business decisions. This could involve anything from adjusting your production schedule to planning your marketing strategy or deciding to enter a new market.
When making decisions based on your forecasts, it’s crucial to consider the entire business context. Your demand forecasts are just one piece of the puzzle. You’ll also need to consider other factors, like your business goals, resources, and the external market environment.
In the end, demand forecasting helps to make informed decisions that drive your business forward using data. By following this six-step framework, you can create accurate, useful demand forecasts that align with your business goals and help you navigate the future with confidence.
How Linnworks makes demand forecasting a breeze
Demand forecasting is essential to the success of any ecommerce business. However, the process can be complex and time-consuming, which is where Linnworks comes in. Linnworks is a leading inventory management platform that simplifies demand forecasting, making it accessible and easy to understand for businesses of all sizes.
Centralizes operations
The first thing that Linnworks does is centralize your operations. Ecommerce businesses often have to juggle multiple sales channels, from their own website to marketplaces like Amazon and eBay. Linnworks consolidates data from all these sources into one place. This not only saves you time but also ensures that your demand forecasts are based on a complete and accurate dataset.
Identifies patterns
One standout feature of the software solution is its advanced analytics capabilities. The platform uses sophisticated algorithms to analyze your sales history and identify patterns that might be indicative of future demand. It also accounts for factors like seasonality and economic trends, increasing the accuracy of your forecasts. Moreover, Linnworks’ user-friendly dashboard displays these insights in an easy-to-understand format, helping you make sense of the data.
Greater personalization
Choosing a forecasting method can be a daunting task for many ecommerce businesses. This process is simplified as the tool recommends the most suitable method based on your specific circumstances. It takes into account your business size, sales volume, industry, and other relevant factors. This personalized approach not only saves you time but also ensures that your forecasts are as accurate as possible.
Improved data collection
Linnworks also offers a range of tools to facilitate current and historical data collection and analysis. It integrates with a variety of third-party applications, making it easy to import data from different sources. You can also customize data fields to suit your specific needs. Once the data is in the solution, you can use its powerful reporting tools to analyze it. These tools enable you to generate a variety of reports, from high-level overviews to detailed breakdowns, helping you gain a deep understanding of your demand patterns.
Simpler interpretation of results
Interpreting the results of your demand forecasts can be challenging, especially if you’re new to the field. But don’t worry – Linnworks has got you covered here too. The platform provides comprehensive support and guidance, helping you understand what the results mean and how to act on them. This includes everything from identifying potential issues to determining the optimal level of stock to carry.
Better-informed business decisions
Finally, Linnworks also equips you with the tools and insights needed to make informed business decisions. The platform’s intuitive interface presents your forecast results in a visually appealing and easily digestible manner. You can see at a glance how demand is expected to evolve over time, which products are likely to be in high demand, and where there might be opportunities for growth. This empowers you to make strategic decisions that can boost your sales and profitability.
Linnworks can streamline the entire demand forecasting process. It combines powerful analytics with user-friendly tools, making it easier than ever to predict demand and optimize your inventory. This means you can spend less time crunching numbers and more time focusing on what really matters: growing your ecommerce business.
Demand forecasting examples

Let’s dive into some real-life examples to make this clear. These examples will show us a few of the typical headaches that pop up in various types of demand forecasting, and, of course, how they were sorted out.
Example 1 – A Fashion Retailer and the Challenge of Seasonality
A high-end fashion retailer was grappling with the challenge of demand forecasting in their highly seasonal industry. Predicting demand for each season’s collection was extremely tricky because fashion trends can change rapidly, and past sales data might not accurately predict future trends.
To address this challenge, the retailer decided to employ a combination of quantitative and qualitative forecasting methods. The quantitative approach used time-series analysis to identify the impact of seasonality on demand, based on historical sales data. Meanwhile, the qualitative approach gathered inputs from fashion experts, designers, and trend forecasters to account for the evolving fashion trends.
Result: This combined approach improved their demand forecast accuracy by 25%, leading to better inventory planning and less end-of-season stock clearance.
Example 2 – A Tech Company and the Challenge of New Product Launches
An electronics company launching a new product line was facing the challenge of forecasting demand for a product with no sales history. Relying on traditional methods of using historical data was not feasible, and the company needed an accurate forecast to avoid stockouts (which could lead to lost sales) and overstocking (which could lead to increased holding costs).
To resolve this, the company turned to analogous forecasting, where they used data from similar product launches to predict the demand for the new product. They analyzed sales data from past product launches, taking into account factors like the marketing budget, pricing strategy, and market conditions at the time. Additionally, they also used social media sentiment analysis and conducted market research to understand potential customers’ interest in the new product.
Result: Their initial demand forecast for the product was within 10% of the actual sales, enabling them to manage their inventory effectively and meet consumer demand promptly.
How Graff City reduced overstocking and underselling with Linnworks
When you think about a graffiti and spray paint supplier hitting it big, you might not consider the logistical headaches behind the scenes. That’s exactly what Graff City, a flourishing supplier in the industry, discovered as their product lines expanded and customer demand spiked.
Inventory management became a considerable challenge for them, as they grappled with issues of overstocking and underselling. Their tools? Manual spreadsheets and a platform named Despatch Cloud, which, unfortunately, was struggling to support their scaling needs.
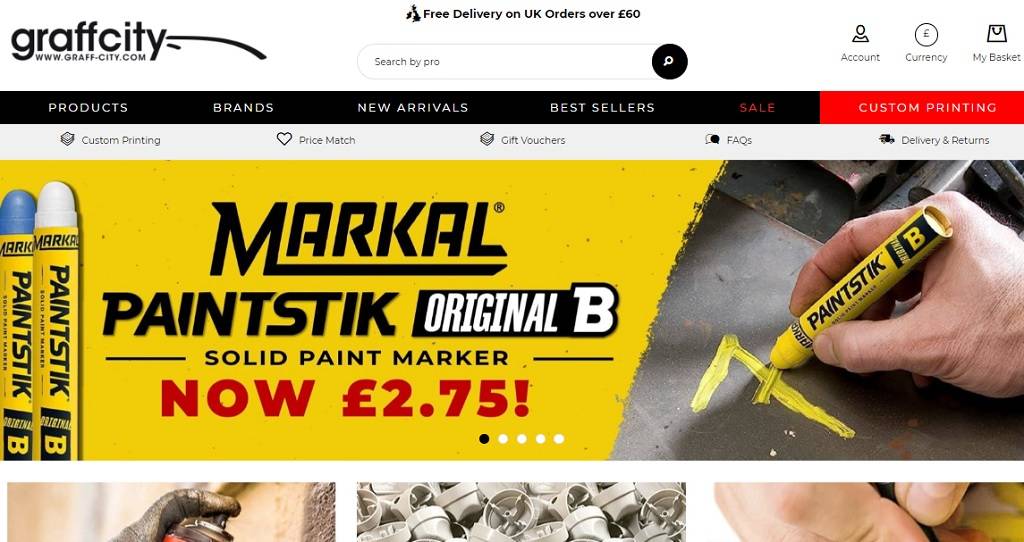
Recognizing these obstacles, Graff City made the strategic move to partner with us here at Linnworks. We helped transform their inventory planning, automating what used to be labor-intensive tasks and saving the team a whopping 8 hours each week.
The standout feature that made a real difference? Our impressive stock forecasting functionality. It offered Graff City valuable insights by predicting inventory levels based on historical data, seasonal shifts, and demand trends.
The result? They significantly cut down their forecasting time from a full day each week to just 30 minutes, without sacrificing accuracy. A game-changing move for sure!
Key takeaways
In an evolving ecommerce landscape, being able to manage and estimate customer demand accurately is pivotal to business success. Demand forecasting is an intricate process that can seem daunting, but it need not be so. By understanding various types of forecasting, considering key influencing factors, and employing a comprehensive framework, businesses can navigate the complexities of demand prediction.
However, the secret ingredient to making demand forecasting not just manageable but truly insightful is a robust platform like Linnworks. Linnworks seamlessly integrates your operations, facilitating a holistic view of your demand trends. With its advanced analytics, personalized method recommendation, and user-friendly interface, Linnworks turns an otherwise challenging process into a breeze.
To experience this game-changing platform for yourself, why not take a tour? Check out our interactive product tour. This is not just any tour, but a self-guided journey that lets you explore the platform at your own pace. There are no sales pitches, no pressures, just a sneak peek of how Linnworks can revolutionize your ecommerce operations. And it only takes 3 minutes!
Demand forecasting FAQs
Q. What is demand forecasting?
Demand forecasting helps to predict future customer demand for a product or service. Demand planners typically conduct the planning process using historical sales data, industry trends, and market analysis. This ensures forecast accuracy to help you make informed decisions going forward.
Q. Why is forecasting demand important?
Forecasting demand is important because it guides critical internal business decisions, like inventory planning, budgeting, and supply chain planning operations. Ensuring demand forecast accuracy helps to prevent overstocking or stockouts, reduce costs, improve cash flow, and enhance customer satisfaction.
Q. How to forecast customer demand?
Demand planners can use a variety of methods for internal business forecasting, such as time-series analysis, regression models, and machine learning algorithms. The process typically involves collecting historical data, identifying trends and patterns, and applying these trends to predict future demand.
Q. How to forecast demand for a new product?
Forecasting demand for a new product can be challenging due to a lack of historical sales data. However, it can be achieved by using methods like market research, competitor analysis, and test marketing. Also, companies can look at historical data of similar products or use judgmental forecasting methods involving experts’ opinions.
Q. What are the types of demand forecasting?
There are various types of demand forecasting, broadly categorized into qualitative and quantitative methods. Qualitative methods include Delphi technique, market research, and expert opinion. Quantitative methods include time-series forecasting, causal models, and artificial intelligence-based methods. The choice depends on factors like data availability, the nature of the product, and the forecasting horizon.